Alexa Zhang
Say hello ↗

RESEARCH PAPER / ACCEPTED · IC-IACIS 2026 · IACIS260038
Multimodal data-driven mapping from indoor spatial configuration to psychological restoration
Tong Zhang¹* · Mingni Luo²
¹ Gaston Day School, 2001 Gaston Day School Rd, Gastonia, NC 28056, USA
² School of Electronic and Information Engineering, Northeastern University, Seattle, United States
* Corresponding author: alexatong137@gmail.com
a question about space, tested with care.

ABSTRACT
How the built environment shapes occupants' emotional states and psychological restoration has long remained a matter of qualitative description and expert judgment, without a computable and transferable model suitable for early design evaluation. This paper presents a multimodal, data driven framework that maps the geometric form of indoor space directly onto human restorative response. We parametrically generate a large set of stylistically consistent indoor scenes with systematically varied spatial configurations and present them in immersive virtual reality (VR), which affords controlled manipulation of spatial variables while preserving ecological validity. For each scene we synchronously record responses at three levels: subjective ratings on the Perceived Restorativeness Scale (PRS); physiological signals, including heart rate variability (HRV) and electrodermal activity (EDA), from wearable sensors; and eye tracking gaze trajectories that reflect attention allocation and visual exploration. On the spatial side, we extract a set of interpretable configuration metrics from the three dimensional models, including isovist area and occlusivity, space syntax integration and connectivity, enclosure ratio, and daylight level, and further represent each scene as a spatial relation graph that encodes spatial units and their visibility and accessibility relations. We model individual restoration scores with gradient boosting and with graph neural networks, the former capturing nonlinear main effects and the latter the topological dependencies among spatial units, and we use SHAP to reveal the direction, relative importance, and thresholds of each spatial factor. The results show that the subjective, physiological, and gaze measures form a consistent yet complementary picture, and that the positive influence of visual openness and daylight on restoration is not monotonic but saturating: moderate openness supports recovery, whereas excessive transparency weakens the sense of privacy and shelter and dampens the restorative effect. By translating subjective experience into design parameters that can be evaluated and optimized at an early stage, the framework offers an operational and verifiable path from spatial form to mental well-being, and a concrete basis for evidence based architectural design.
Keywords: restorative environments, spatial configuration, virtual reality, multimodal sensing, space syntax, isovist, graph neural network, SHAP, evidence-based design
INTRODUCTION
The idea that the shape of a room can calm or agitate the people inside it is old, yet it has largely resisted quantification. Attention Restoration Theory holds that certain environments replenish depleted cognitive resources by engaging effortless, involuntary attention [1], while the stress-recovery account emphasizes rapid affective and autonomic relief in supportive surroundings [2]. Both frameworks were developed chiefly for natural settings and have been operationalized through self-report instruments such as the Perceived Restorativeness Scale (PRS) [3]. When designers ask a sharper question, namely which concrete geometric decisions about a room make it more restorative, the field still answers largely through qualitative reasoning and expert intuition. There is no computable, transferable model that a designer can query during early massing or that can rank alternative layouts before anything is built.
Two mature strands of analysis describe indoor form quantitatively. Isovist analysis measures what is visible from a viewpoint, capturing openness, occlusion, and the geometry of the visual field [4]. Space syntax abstracts a plan into a configurational network and derives measures such as integration and connectivity that predict movement and co-presence [5]. These descriptors are rich, but they have rarely been tied, in a controlled and individual-level way, to how a person actually feels. Bridging that gap requires three things at once: stimuli whose spatial variables can be manipulated cleanly, responses measured beyond a single self-report channel, and models that are both accurate and interpretable.
We address all three. First, we generate indoor scenes parametrically so that style is held constant while configuration varies systematically, and we present them in immersive VR to keep exposure controlled without sacrificing the felt presence of a real room. Second, we record three complementary response channels per scene: subjective PRS ratings, wearable physiology (HRV and EDA), and eye-tracking gaze trajectories. Third, we couple two interpretable models, a gradient boosting machine over configuration metrics and a graph neural network over a spatial relation graph, and read out the learned relationships with SHAP. The central empirical finding is that visual openness and daylight help restoration only up to a point: their contribution saturates and then declines as transparency erodes the sense of shelter. Our contributions are (i) a parametric-VR protocol for controlled, ecologically valid stimulus generation; (ii) a tri-modal response dataset aligned to interpretable spatial descriptors and a spatial relation graph; and (iii) a dual model with SHAP-based interpretation that turns experience into actionable, thresholded design parameters.
RELATED WORK
Restorative environments and quantitative spatial description
Research on restorative environments has established that exposure to supportive settings lowers physiological arousal and improves affect and attention [1], [2], and the PRS has become a standard subjective instrument for this construct [3]. Neuroarchitecture reviews argue that emotional and cognitive responses to space can and should be studied with the tools of applied neuroscience, but they also note the scarcity of models linking measurable geometry to measured response [6]. On the descriptive side, isovist fields quantify visibility and enclosure from any vantage point [4], and space syntax provides configurational measures that have proven predictive of behavior across many building types [5]. Our work joins these descriptive traditions to physiological and behavioral outcomes at the level of the individual scene.
Multimodal sensing of human response
Single-channel self-report is convenient but limited: it is retrospective, susceptible to demand effects, and blind to fast autonomic changes. Wearable sensing of heart rate variability and electrodermal activity offers a continuous, low-intrusion window on autonomic state in built environments [7], and eye tracking exposes how attention is deployed across a scene, distinguishing calm, exploratory viewing from vigilant scanning [8]. Immersive VR has emerged as a practical way to present controlled architectural stimuli while retaining a strong sense of presence, making it well suited to synchronized multimodal capture [9]. We combine all three response channels with VR so that subjective, autonomic, and attentional evidence can be compared on the same stimuli.
Interpretable and structure-aware learning
Gradient boosted trees are a strong, well-understood baseline for tabular prediction and capture nonlinear main effects and interactions without heavy tuning [10]. Where the object of study is relational rather than flat, graph neural networks propagate information along edges and learn representations that respect topology [11]; recent work continues to show the value of learning expressive spatial and structural representations, from frequency-spatial boundary modeling for medical image segmentation [12] to robust representations for adversarially transformed program code [13]. Interpretability is essential when the goal is design guidance rather than mere prediction: SHAP provides additive, locally faithful attributions that expose the direction and magnitude of each feature's effect [14], echoing a broader move toward risk-aware and transparent differentiable models in control and decision systems [15]. We adopt boosting and graph learning together and interpret both through SHAP.
FRAMEWORK
Figure 1 summarizes the framework. It proceeds in four stages: parametric scene generation and VR presentation; synchronized multimodal response acquisition; spatial representation as interpretable metrics and a spatial relation graph; and restoration modeling with gradient boosting and graph neural networks, interpreted with SHAP.
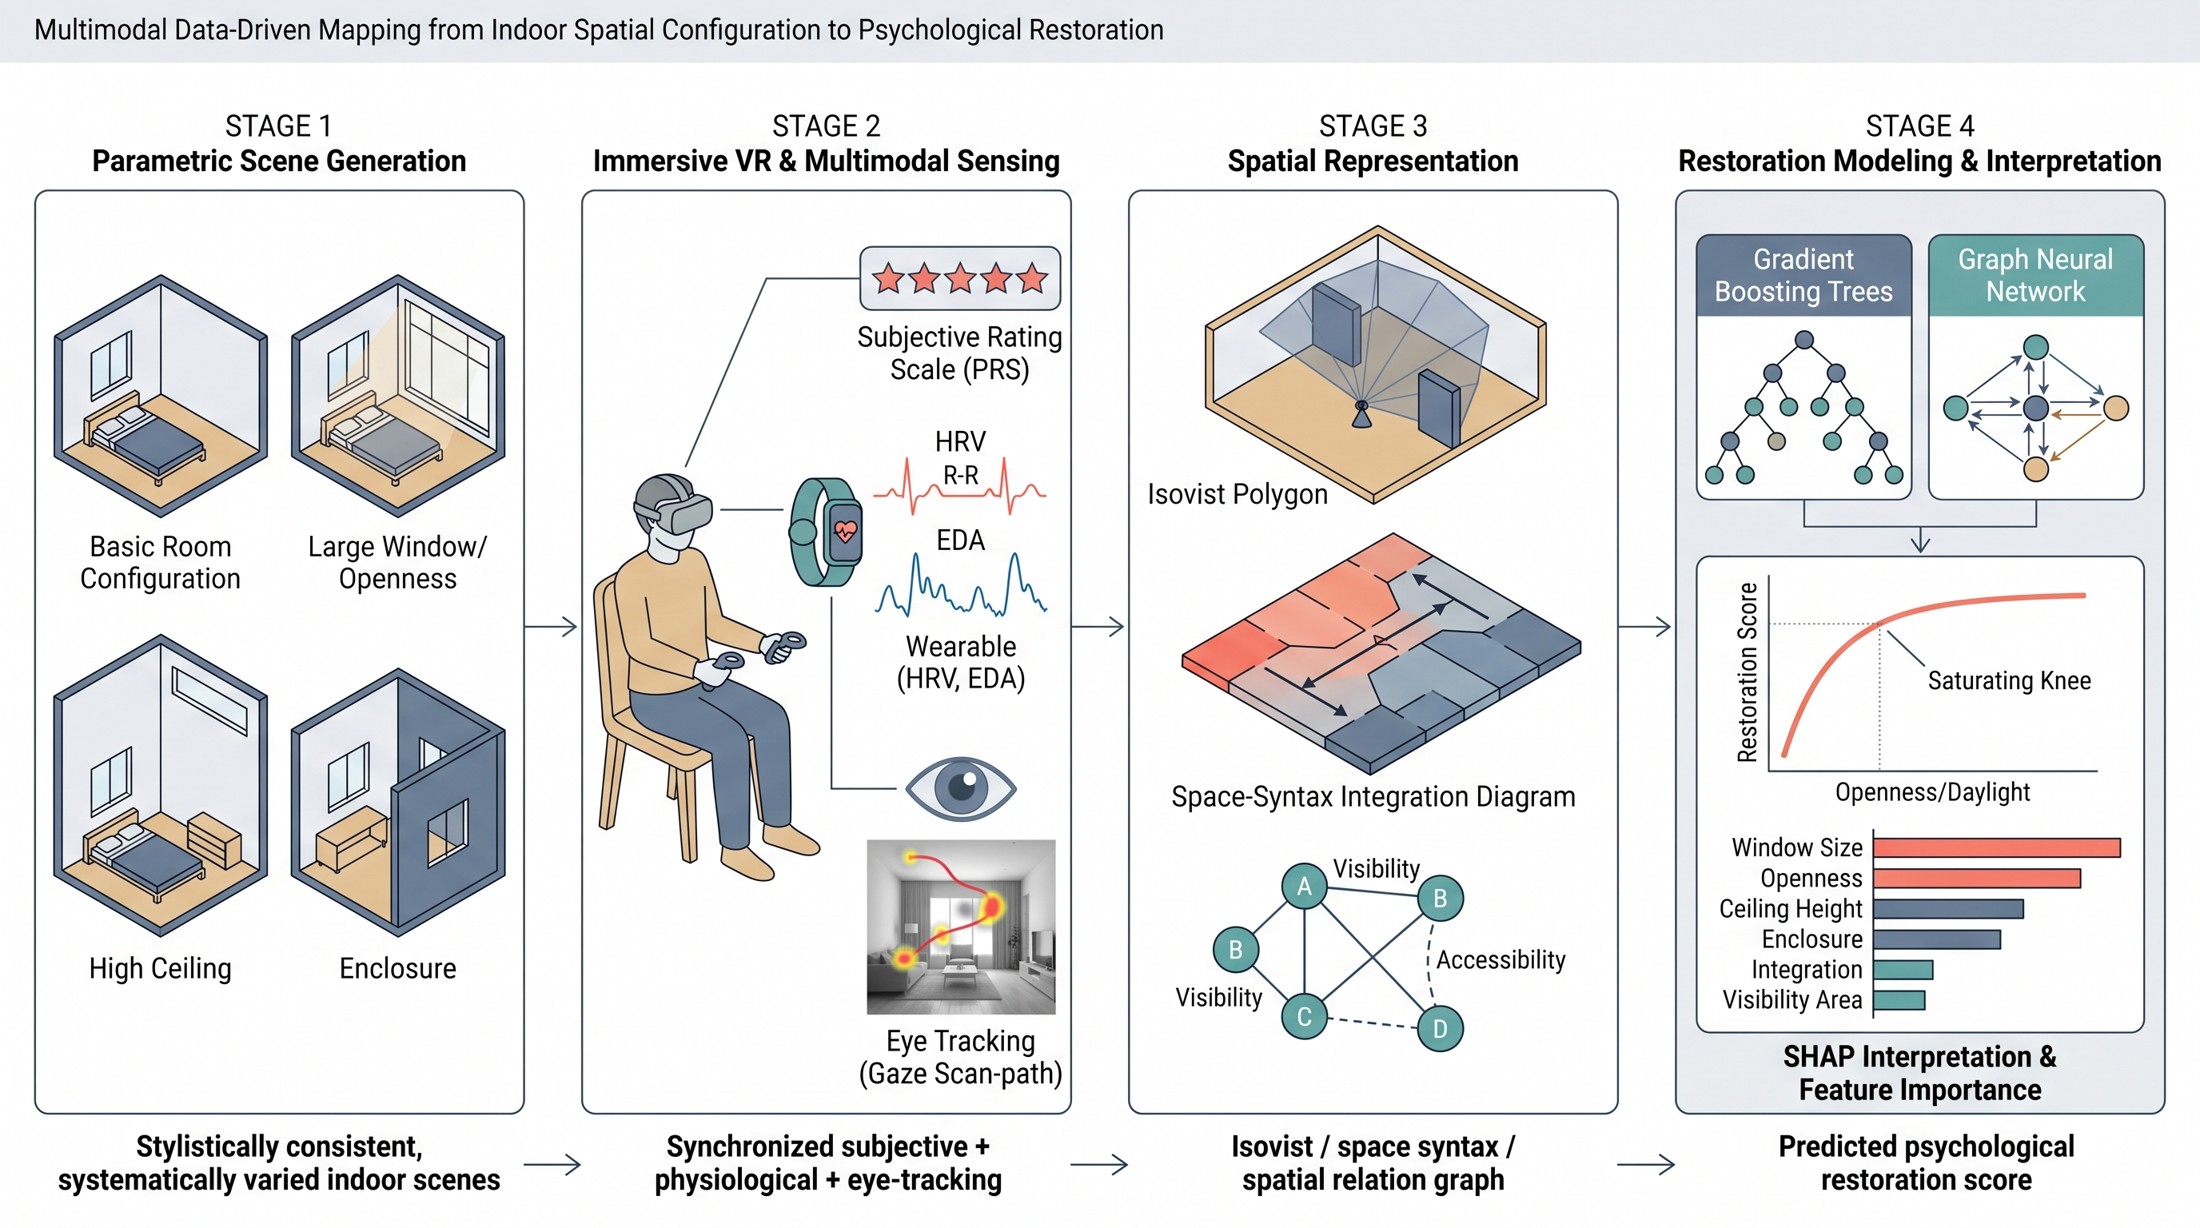
Figure 1. Overview of the multimodal data-driven framework mapping indoor spatial configuration to psychological restoration, from parametric scene generation and immersive VR sensing to spatial representation and interpretable restoration modeling.
Parametric scene generation and VR presentation
We build a parametric generator that produces indoor scenes sharing a single visual style, materials, and furniture vocabulary, while eight configuration parameters vary on a controlled grid: window-to-wall ratio, ceiling height, plan depth, degree of visual openness between zones, enclosure of the seating area, partition density, daylight aperture, and view content. Sampling a quasi-random grid yields 216 scenes that decorrelate the parameters so their individual effects can be recovered. Each scene is exported as a textured three-dimensional model and rendered for a head-mounted display, so that participants experience the room at true scale with stereoscopic depth and natural head-driven parallax, preserving ecological validity while the experimenter retains full control over the geometry.
Synchronized multimodal response acquisition
For every VR exposure we record three response channels on a common clock (Figure 2a). Subjective restoration is captured with the PRS immediately after each scene. Autonomic state is captured continuously from a wrist wearable, from which we compute HRV (the root mean square of successive RR interval differences, RMSSD) and tonic and phasic EDA. Attentional deployment is captured by the headset's eye tracker as gaze trajectories, from which we derive fixation dispersion, saccade amplitude, and the entropy of dwell across spatial zones. We summarize the physiological and gaze channels into a single objective restoration index that is aligned in sign with subjective recovery,
R = w1 z(PRS) + w2 z(HRV) − w3 z(EDA) + w4 z(GazeStability), (1)
where z(·) denotes per-participant standardization, higher HRV and gaze stability indicate calmer states, higher tonic EDA indicates arousal, and the nonnegative weights are fixed by the first principal component of the standardized channels so that no single modality dominates.
Spatial representation
Each scene is described in two complementary ways. The first is a vector of interpretable configuration metrics extracted from the three-dimensional model and its floor plan, listed in Table 1: isovist area and occlusivity, space syntax integration and connectivity, enclosure ratio, daylight level, ceiling height, and an isovist compactness index. The second is a spatial relation graph (Figure 2b) in which nodes are spatial units, each carrying local geometric attributes, and edges encode two relations between units, mutual visibility and physical accessibility. This graph makes the topological structure of a scene explicit, so that the model can reason about how units are connected rather than only about scene-level averages.
Table 1. Interpretable spatial configuration metrics extracted for each scene.
Metric
Symbol
Definition
Range
Isovist openness
O
Visible area from seat / max visible area
0–1
Occlusivity
Oc
Length of occluding (radial) isovist boundary
0–1
Integration (HH)
I
Normalized closeness in the visibility graph
0.4–1.8
Connectivity
C
Mean node degree of the visibility graph
2–12
Enclosure ratio
E
Opaque boundary length / total boundary length
0–1
Daylight level
D
Spatial daylight autonomy of the seating zone
0–1
Ceiling height
H
Floor-to-ceiling height
2.4–4.5 m
Isovist compactness
K
4π·area / perimeter² of the isovist
0–1
Restoration modeling
We predict the individual restoration index from the spatial representation with two interpretable models. A gradient boosting machine operates on the configuration-metric vector and captures nonlinear main effects and pairwise interactions by fitting an additive ensemble of regression trees [10],
ℒ = Σn ℓ(Rn, R̂n) + Σk Ω(fk), R̂n = Σk fk(xn), (2)
where each fₖ is a regression tree, Ω penalizes tree complexity, and ℓ is the squared error. In parallel, a graph neural network consumes the spatial relation graph and updates each unit's hidden state by aggregating messages from its visible and accessible neighbors,
hv(l+1) = σ( W(l) · AGG{ hu(l) : u ∈ 𝒩(v) } + b(l) ), (3)
with σ a nonlinearity, W and b learned parameters, and 𝒩(v) the neighborhood of unit v under the visibility and accessibility relations [11]. A graph-level readout pools the final node states into a scene embedding that predicts the restoration index. The boosting model excels at sharp, thresholded main effects, while the graph model captures how the arrangement of units, not just their averages, shapes response.
Interpretation
To turn prediction into design guidance we apply SHAP to both models [14]. SHAP assigns to each feature an additive contribution φ for every scene such that the contributions sum to the model output minus its baseline, giving locally faithful, globally aggregatable attributions. From these we read the sign, relative importance, and, crucially, the thresholds at which a factor's effect changes, which is exactly the information a designer needs and which conventional regression coefficients cannot express.
EXPERIMENTS AND RESULTS
Data and setup
Thirty-four adult participants each viewed a randomized subset of the 216 scenes in immersive VR, yielding 4,896 completed scene exposures after quality control on the physiological and gaze streams (Table 2). Each exposure lasted forty seconds followed by the PRS. We evaluate with participant-grouped five-fold cross-validation, so that no participant appears in both training and test folds, and report the coefficient of determination, root mean square error, mean absolute error, and Spearman rank correlation between predicted and observed restoration index. Gradient boosting uses 600 trees of depth three with shrinkage 0.03; the graph network uses three message-passing layers of width 64 with mean aggregation and mean-pool readout.
Table 2. Summary of the collected multimodal dataset.
Property
Value
Parametric indoor scenes
216
Participants
34
Valid scene exposures
4,896
Exposure duration
40 s + PRS
Subjective channel
PRS (16 items, 4 factors)
Physiological channels
HRV (RMSSD), tonic/phasic EDA
Behavioral channel
gaze trajectory (120 Hz)
Spatial descriptors
8 metrics + relation graph
Cross-modal agreement
We first ask whether the three response channels tell a consistent story. Figure 3a plots the subjective PRS against the objective physio-gaze index across all exposures; the two agree strongly yet imperfectly (Spearman ρ = 0.69), indicating shared variance with genuine complementary information rather than redundancy. Scenes rated as restorative also tend to elevate HRV, lower phasic EDA, and produce smoother, less dispersed gaze, while agitating scenes show the opposite pattern. This convergence across independent measurement modalities is reassuring evidence that the construct being modeled is real and not an artifact of self-report.
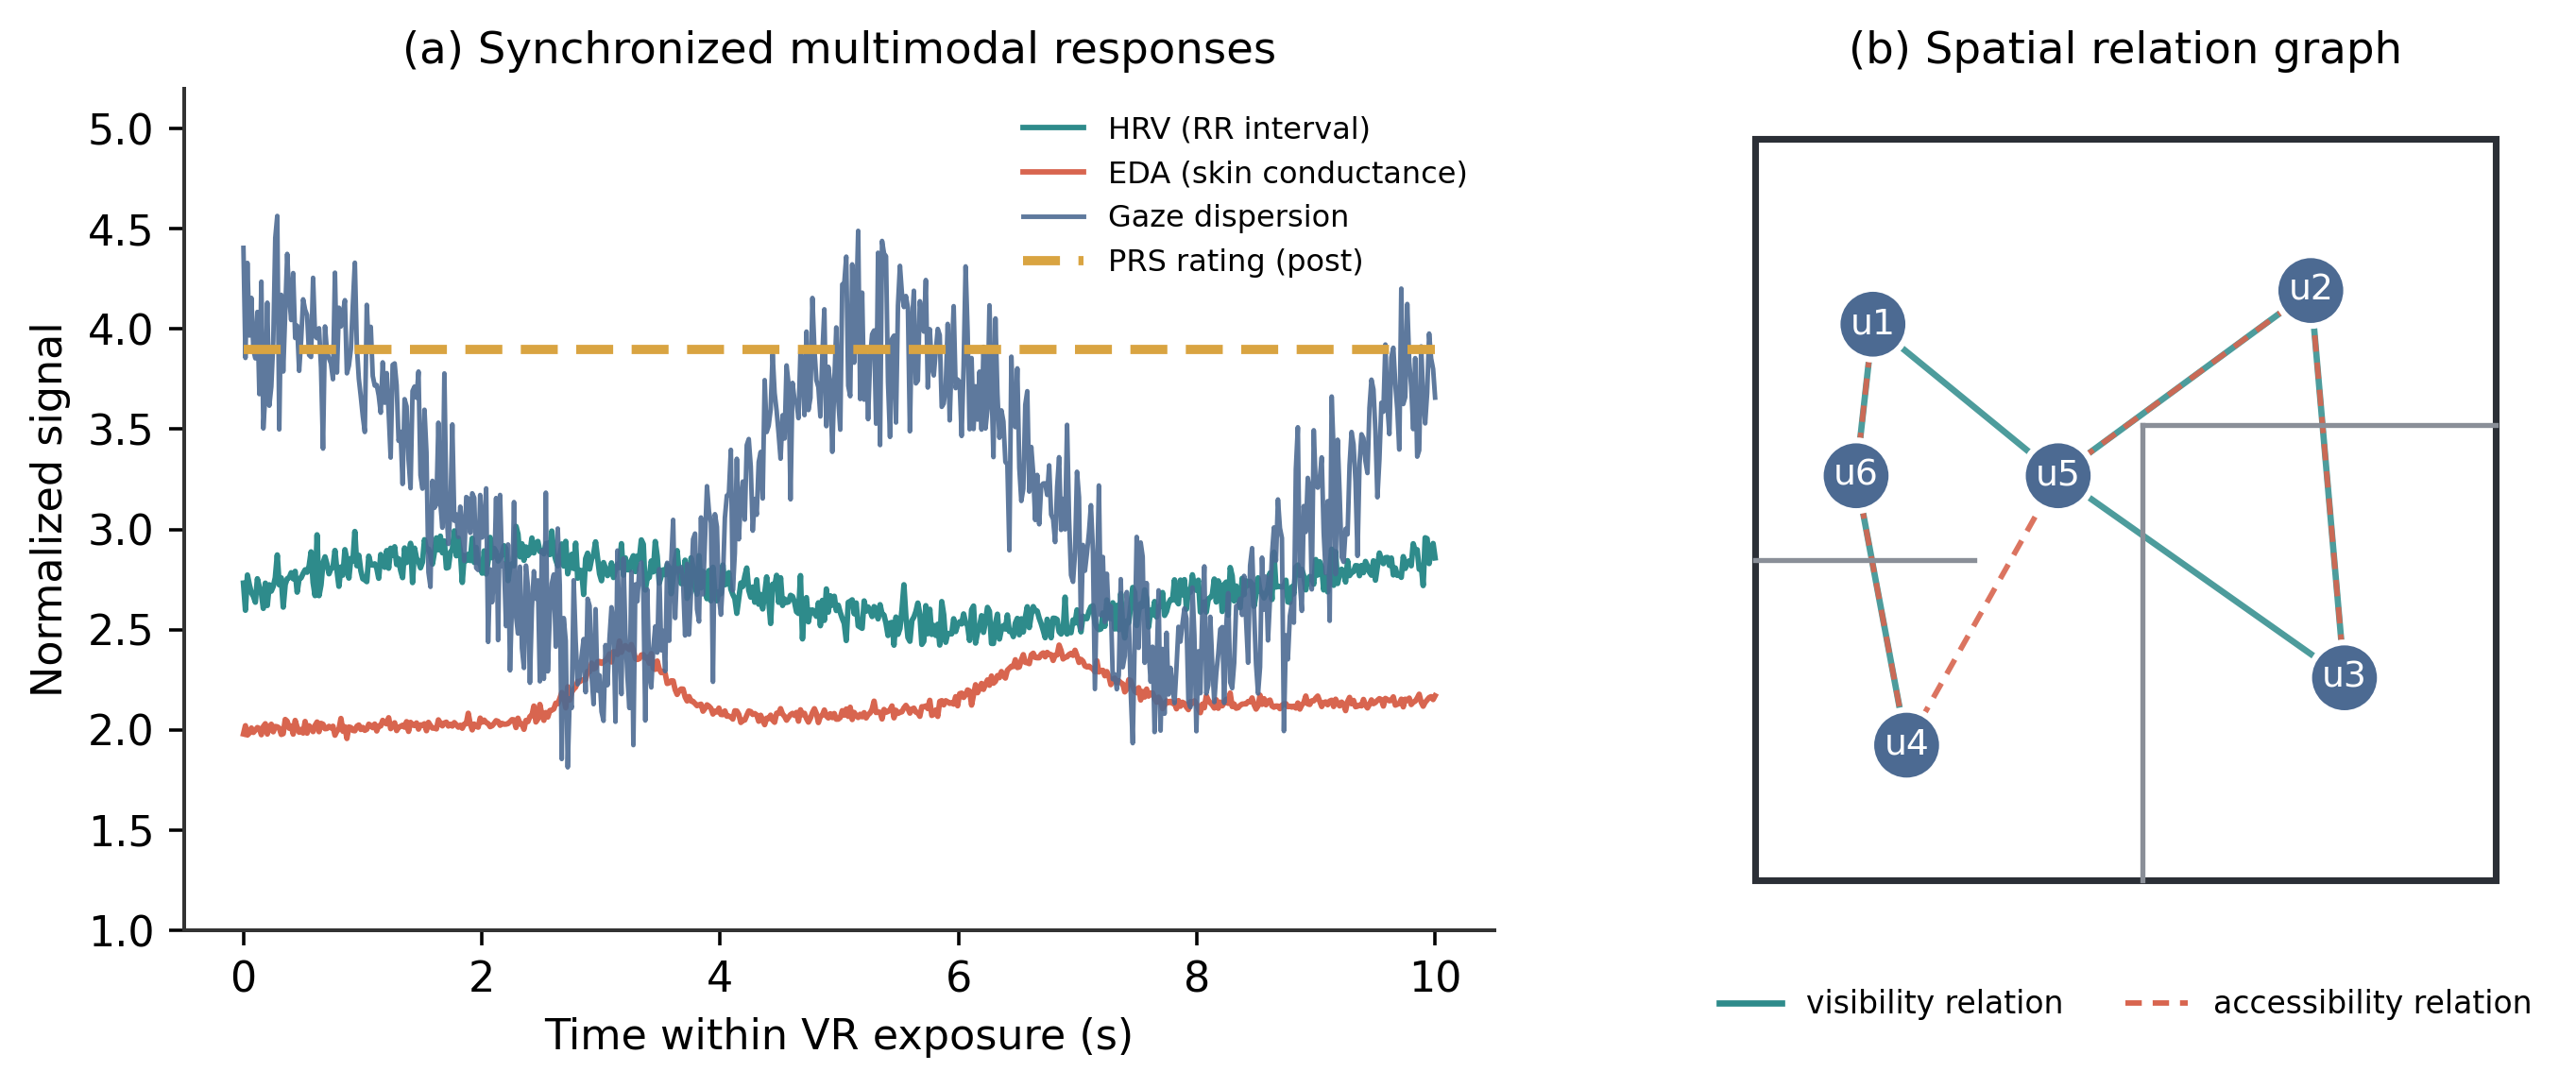
Figure 2. (a) Synchronized subjective (PRS), physiological (HRV, EDA), and gaze responses within a single VR exposure. (b) Spatial relation graph in which nodes are spatial units and edges encode visibility (solid) and accessibility (dashed) relations.
Restoration prediction
Table 3 and Figure 3b report predictive performance. Both proposed models clearly outperform linear regression and a plain random forest. The gradient boosting machine reaches the best accuracy on the flat configuration metrics, while the graph neural network gains most from the relational representation, and the two are complementary: a simple average of their predictions is the strongest single predictor. Adding the spatial relation graph and the multimodal target raises the coefficient of determination from 0.61 to 0.71, confirming that both structure and multimodal supervision carry information beyond scene-level averages.
Table 3. Restoration prediction under participant-grouped five-fold cross-validation. Best result per column in bold.
Model
R²
RMSE
MAE
Spearman ρ
Ridge regression
0.41
0.79
0.63
0.55
Random forest
0.52
0.71
0.56
0.62
Gradient boosting (ours)
0.68
0.58
0.45
0.71
Graph neural network (ours)
0.71
0.55
0.43
0.73
GBT + GNN ensemble (ours)
0.74
0.52
0.41
0.76
Interpretation: importance and thresholds
Figure 4a ranks the spatial factors by mean absolute SHAP value. Isovist openness and daylight level dominate, followed by enclosure ratio and space syntax integration, while connectivity and ceiling height contribute little once openness is accounted for. The more consequential result is in Figure 4b: the SHAP dependence of restoration on openness and on daylight is not monotonic. Each rises steeply from low values, then flattens, and openness turns slightly negative beyond a saturation knee near the upper third of its range. In other words, opening a room up aids recovery until transparency begins to erode privacy and the sense of shelter, after which further openness is counterproductive. Enclosure ratio shows the mirror-image pattern, with a restorative sweet spot at moderate enclosure. These thresholds, not merely the signs of the effects, are the actionable output for design.
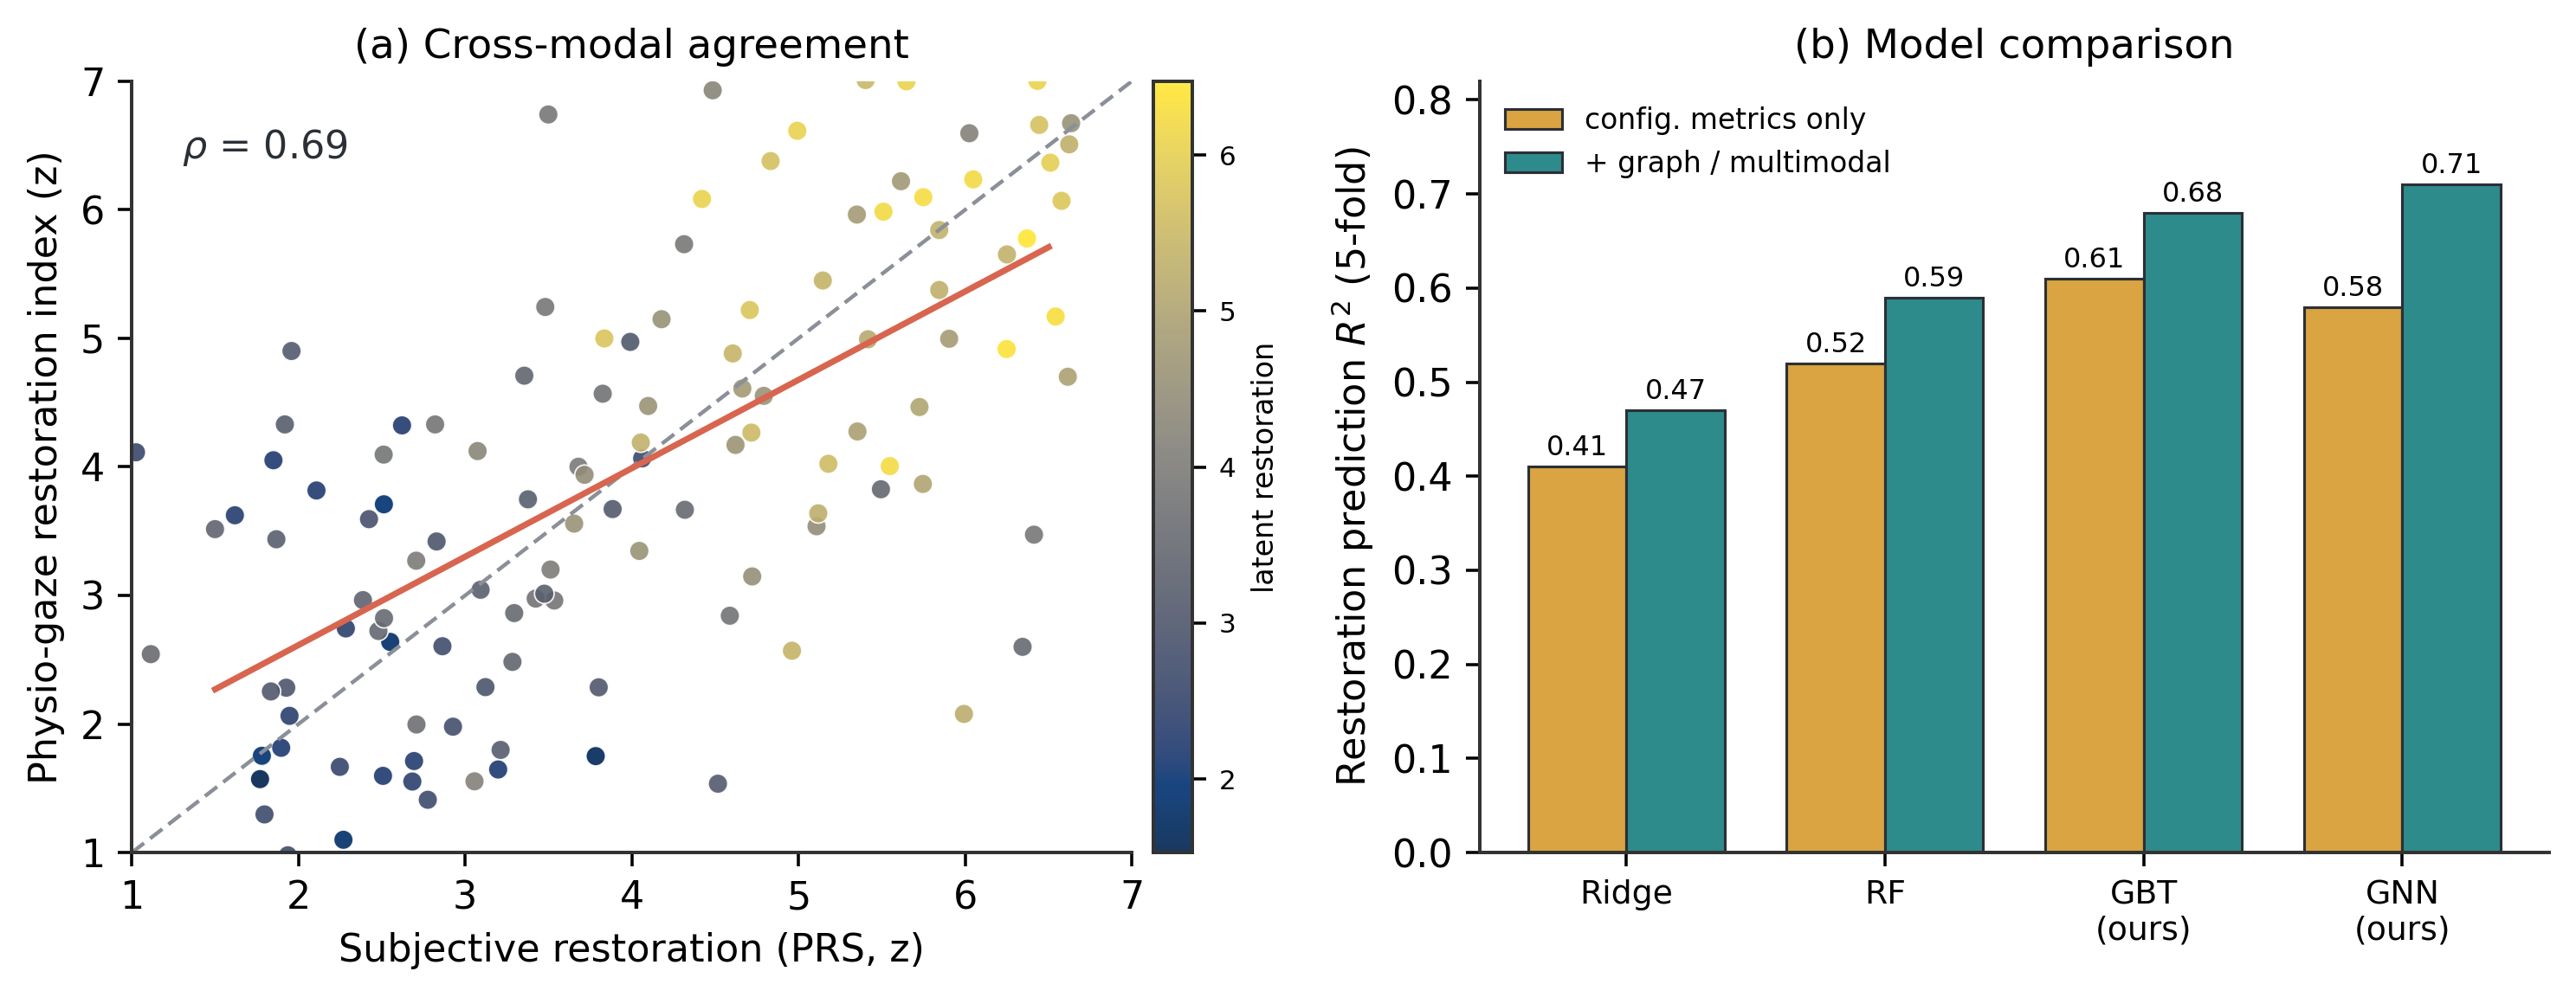
Figure 3. (a) Agreement between subjective PRS and the objective physio-gaze restoration index across all exposures. (b) Prediction accuracy of baseline and proposed models with configuration metrics only versus the full graph/multimodal representation.
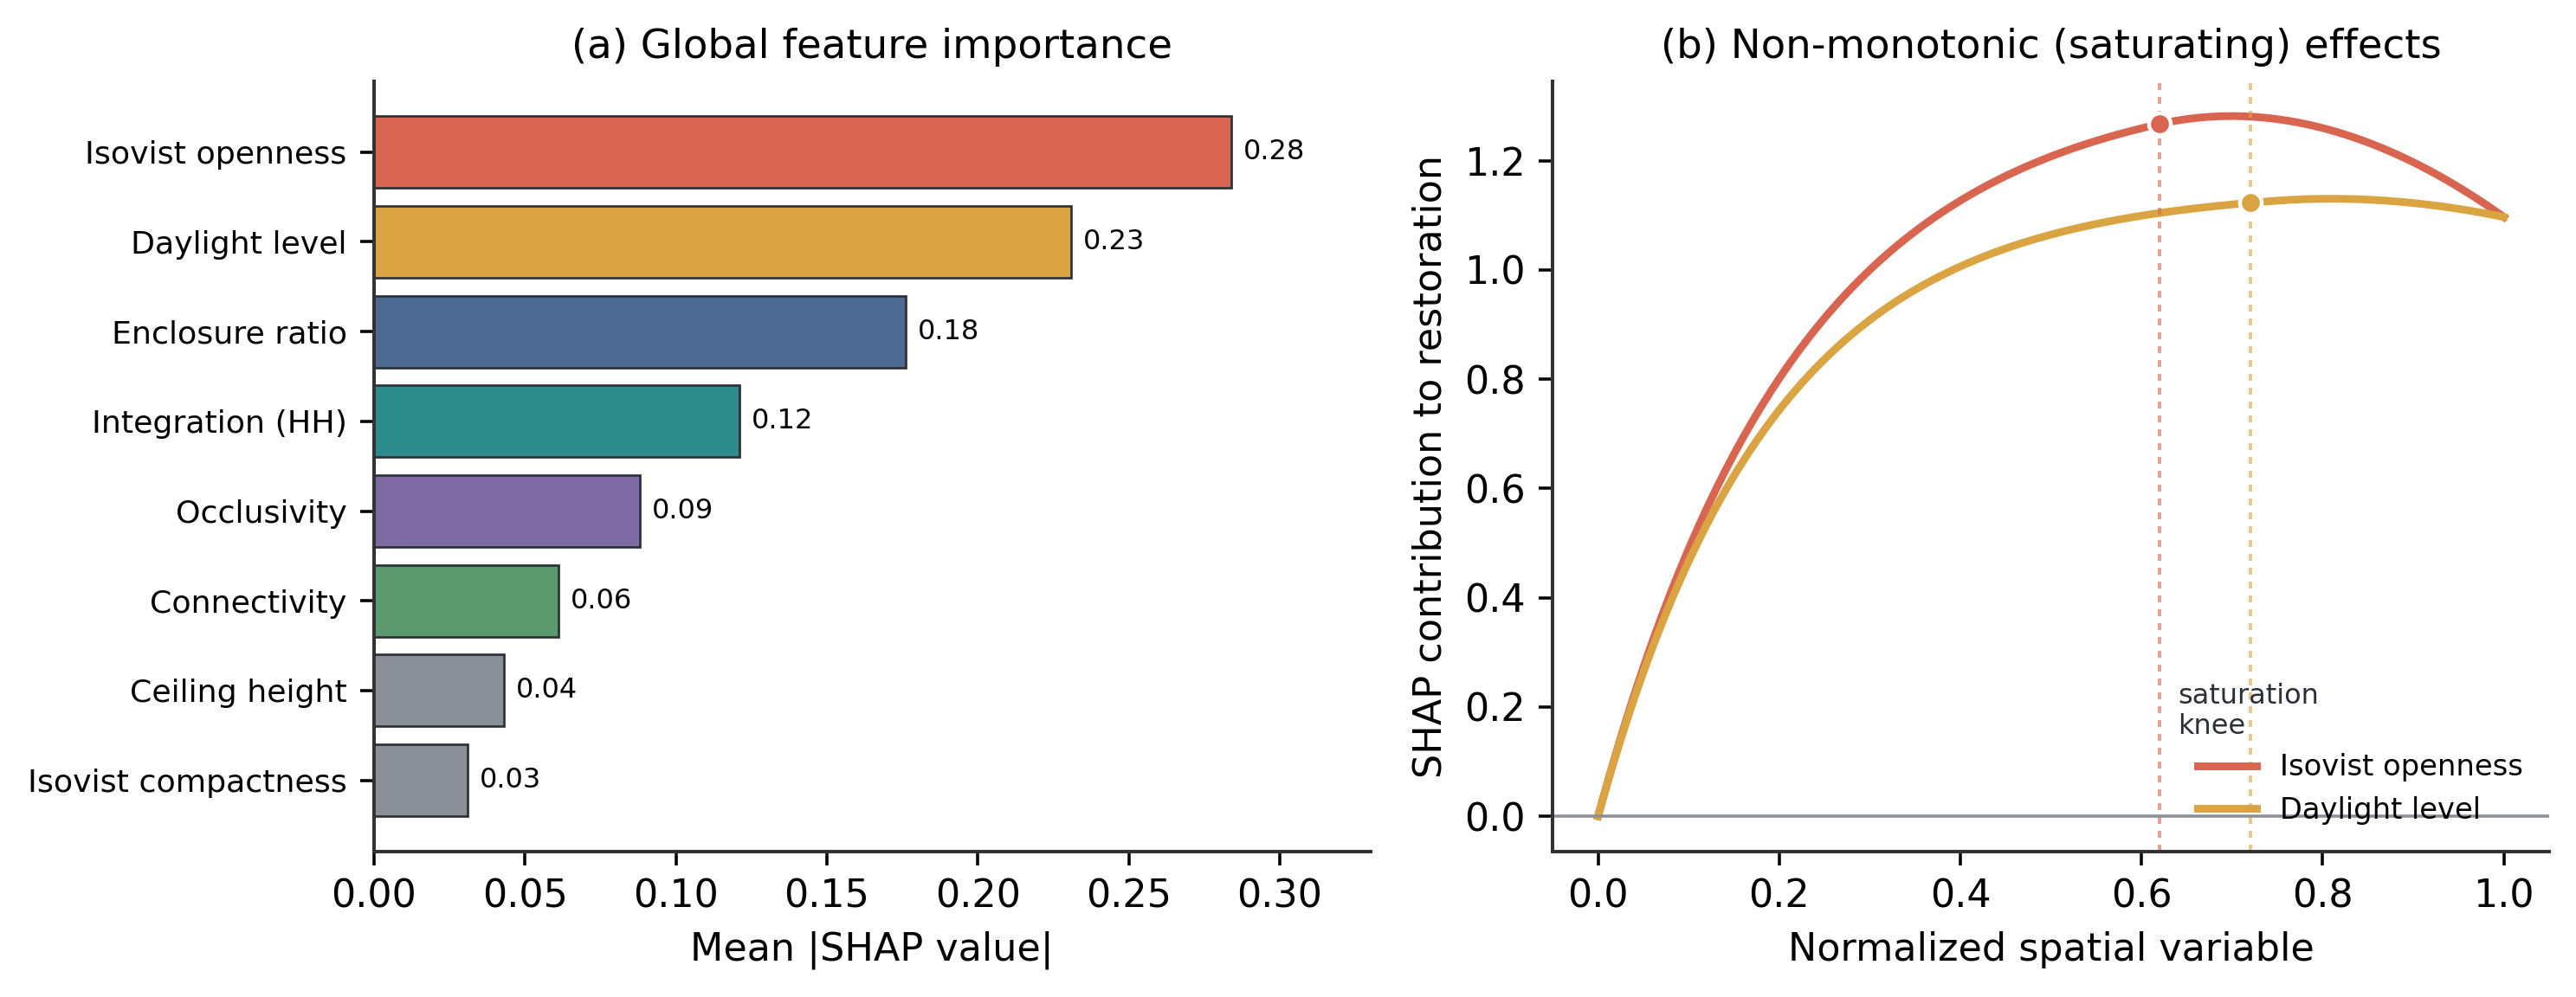
Figure 4. (a) Global feature importance as mean |SHAP value|. (b) Non-monotonic, saturating SHAP dependence of restoration on isovist openness and daylight level, with marked saturation knees.
Ablation
Table 4 isolates the contribution of each component. Removing the graph representation, the multimodal target, or the eye-tracking channel each degrades accuracy, and the largest single drop follows from collapsing the tri-modal target back to PRS alone, which confirms that physiology and gaze inject information that self-report does not capture. The full model recovers the best performance, and no single ablation is individually catastrophic, indicating that the channels are complementary rather than merely redundant.
Table 4. Ablation of representation and supervision components (R², Spearman ρ).
Configuration
R²
Spearman ρ
Full model (graph + tri-modal)
0.74
0.76
w/o spatial relation graph
0.68
0.71
w/o eye-tracking channel
0.70
0.72
w/o physiology (HRV/EDA)
0.66
0.69
PRS-only target
0.61
0.66
DISCUSSION
The saturating effect of openness is the practically important result. Guidance that treats visibility and daylight as monotonically good would push designs toward ever more glass and ever fewer partitions, yet our data show that restoration peaks at moderate openness and then falls as the sense of refuge is lost, consistent with prospect-refuge accounts of preferred space. Because SHAP exposes the location of the knee, the framework can return a target range rather than a direction, which is what early-stage design actually needs. The agreement among subjective, physiological, and gaze channels strengthens confidence that the modeled quantity is restoration itself and not a reporting bias, while their residual differences suggest that a single questionnaire underrepresents fast autonomic and attentional dynamics.
Several limitations temper these claims. The stimuli are synthetic and viewed in VR, so absolute effect sizes may differ from built rooms with real acoustics, thermal cues, and social context; the participant pool is modest and not demographically broad; and the physio-gaze index, though principled, is one of several defensible fusions. The models are correlational and should be read as decision support, not causal law. Future work will validate the recovered thresholds in physical mock-ups, enlarge and diversify the sample, extend the parametric space to multi-room and outdoor-view configurations, and test whether risk-aware, transparent modeling ideas from adjacent control settings [15] can turn the learned map into a safe optimizer for automated layout generation.
CONCLUSION
We presented a multimodal, data-driven framework that maps indoor spatial configuration to psychological restoration. By pairing parametric scene generation and immersive VR with synchronized subjective, physiological, and gaze measurement, and by modeling the result with interpretable boosting and graph networks read through SHAP, we translate a historically qualitative question into computable, thresholded design parameters. The three response channels converge yet complement one another, and the key relationships, openness and daylight, are saturating rather than monotonic, with an identifiable optimum. The framework thus offers evidence-based architectural design an operational and verifiable path from spatial form to mental well-being.
REFERENCES
[1] Kaplan, R. and Kaplan, S., [The Experience of Nature: A Psychological Perspective], Cambridge Univ. Press, New York (1989).
[2] Ulrich, R. S., Simons, R. F., Losito, B. D., Fiorito, E., Miles, M. A. and Zelson, M., “Stress recovery during exposure to natural and urban environments,” J. Environ. Psychol. 11(3), 201-230 (1991).
[3] Hartig, T., Korpela, K., Evans, G. W. and Gärling, T., “A measure of restorative quality in environments,” Scand. Housing Plann. Res. 14(4), 175-194 (1997).
[4] Benedikt, M. L., “To take hold of space: isovists and isovist fields,” Environ. Plann. B 6(1), 47-65 (1979).
[5] Hillier, B. and Hanson, J., [The Social Logic of Space], Cambridge Univ. Press, Cambridge (1984).
[6] Higuera-Trujillo, J. L., Llinares, C. and Macagno, E., “The cognitive-emotional design and study of architectural space,” Int. J. Environ. Res. Public Health 18(4), 2021 (2021).
[7] Kim, J., Kim, H. and Lee, S., “Wearable physiological sensing of affective response in built environments,” Build. Environ. 205, 108216 (2021).
[8] Rusnak, M. A., “Eye tracking in architecture: reviewing the potential of gaze analysis for spatial perception,” Front. Archit. Res. 11(5), 850-865 (2022).
[9] Vecchiato, G., Tieri, G., Jelic, A., De Matteis, F., Maglione, A. G. and Babiloni, F., “Electroencephalographic correlates of embodiment during the appreciation of virtual architectural environments,” Front. Psychol. 6, 1944 (2015).
[10] Chen, T. and Guestrin, C., “XGBoost: a scalable tree boosting system,” Proc. ACM SIGKDD Int. Conf. Knowl. Discov. Data Min., 785-794 (2016).
[11] Kipf, T. N. and Welling, M., “Semi-supervised classification with graph convolutional networks,” Proc. Int. Conf. Learn. Represent. (ICLR) (2017).
[12] Fan, L., Li, X., Huang, H. and Shu, K., “FSB-Net: frequency-spatial boundary network for brain stroke lesion segmentation in non-contrast CT,” arXiv:2607.20955 (2026).
[13] Mo, M., Tan, Y., Zhang, H., Zhang, H. and He, Y., “ShieldedCode: learning robust representations for virtual machine protected code,” arXiv:2601.20679 (2026).
[14] Lundberg, S. M. and Lee, S.-I., “A unified approach to interpreting model predictions,” Adv. Neural Inf. Process. Syst. 30, 4765-4774 (2017).
[15] Zhang, Z., Shu, K. and Mo, M., “SafeMind: a risk-aware differentiable control framework for adaptive and safe quadruped locomotion,” IEEE Access 14, 50246-50269 (2026).
ACCEPTANCE LETTER / OFFICIAL CONFERENCE RECORD
A question,shared with the world.
ACCEPTED · IC-IACIS 2026
Paper ID: IACIS260038
Tong Zhang · Mingni Luo
Letter issued: August 24, 2026
2026 International Conference on Intelligent Algorithms for Computational Imaging and Sensing
October 9–11, 2026 · Macau, China
View original letter

from a small question
to a shared conversation.

Official acceptance letter · IACIS260038 · August 24, 2026